Performance Analysis
Rig Performance
- Client
- Drilling contractor
- Country
- Asia, Africa, USA
- Year
- 2024
- Industry
- Oil & Gas
- Service
- Industrial Data and AI
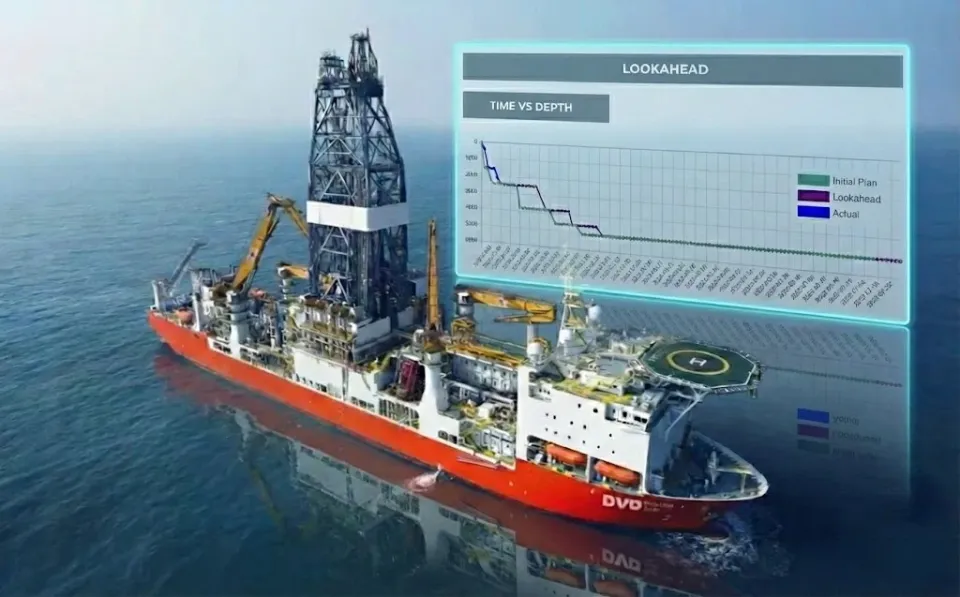
Macro KPIs give only a coarse view of where time goes on a long drilling campaign. For a drilling contractor, ID3 detected rig operations automatically from mud logging data and compared a drillship's performance with three similar campaigns.
The challenge
On long drilling campaigns, raising performance is fundamental: every operation has to be optimized to reduce time and cost as much as possible.
Standard performance evaluation relies on macro KPIs such as drilling ROP and flat time duration. Yet the more accurate the time analysis, the greater the potential for improvement.
Our approach
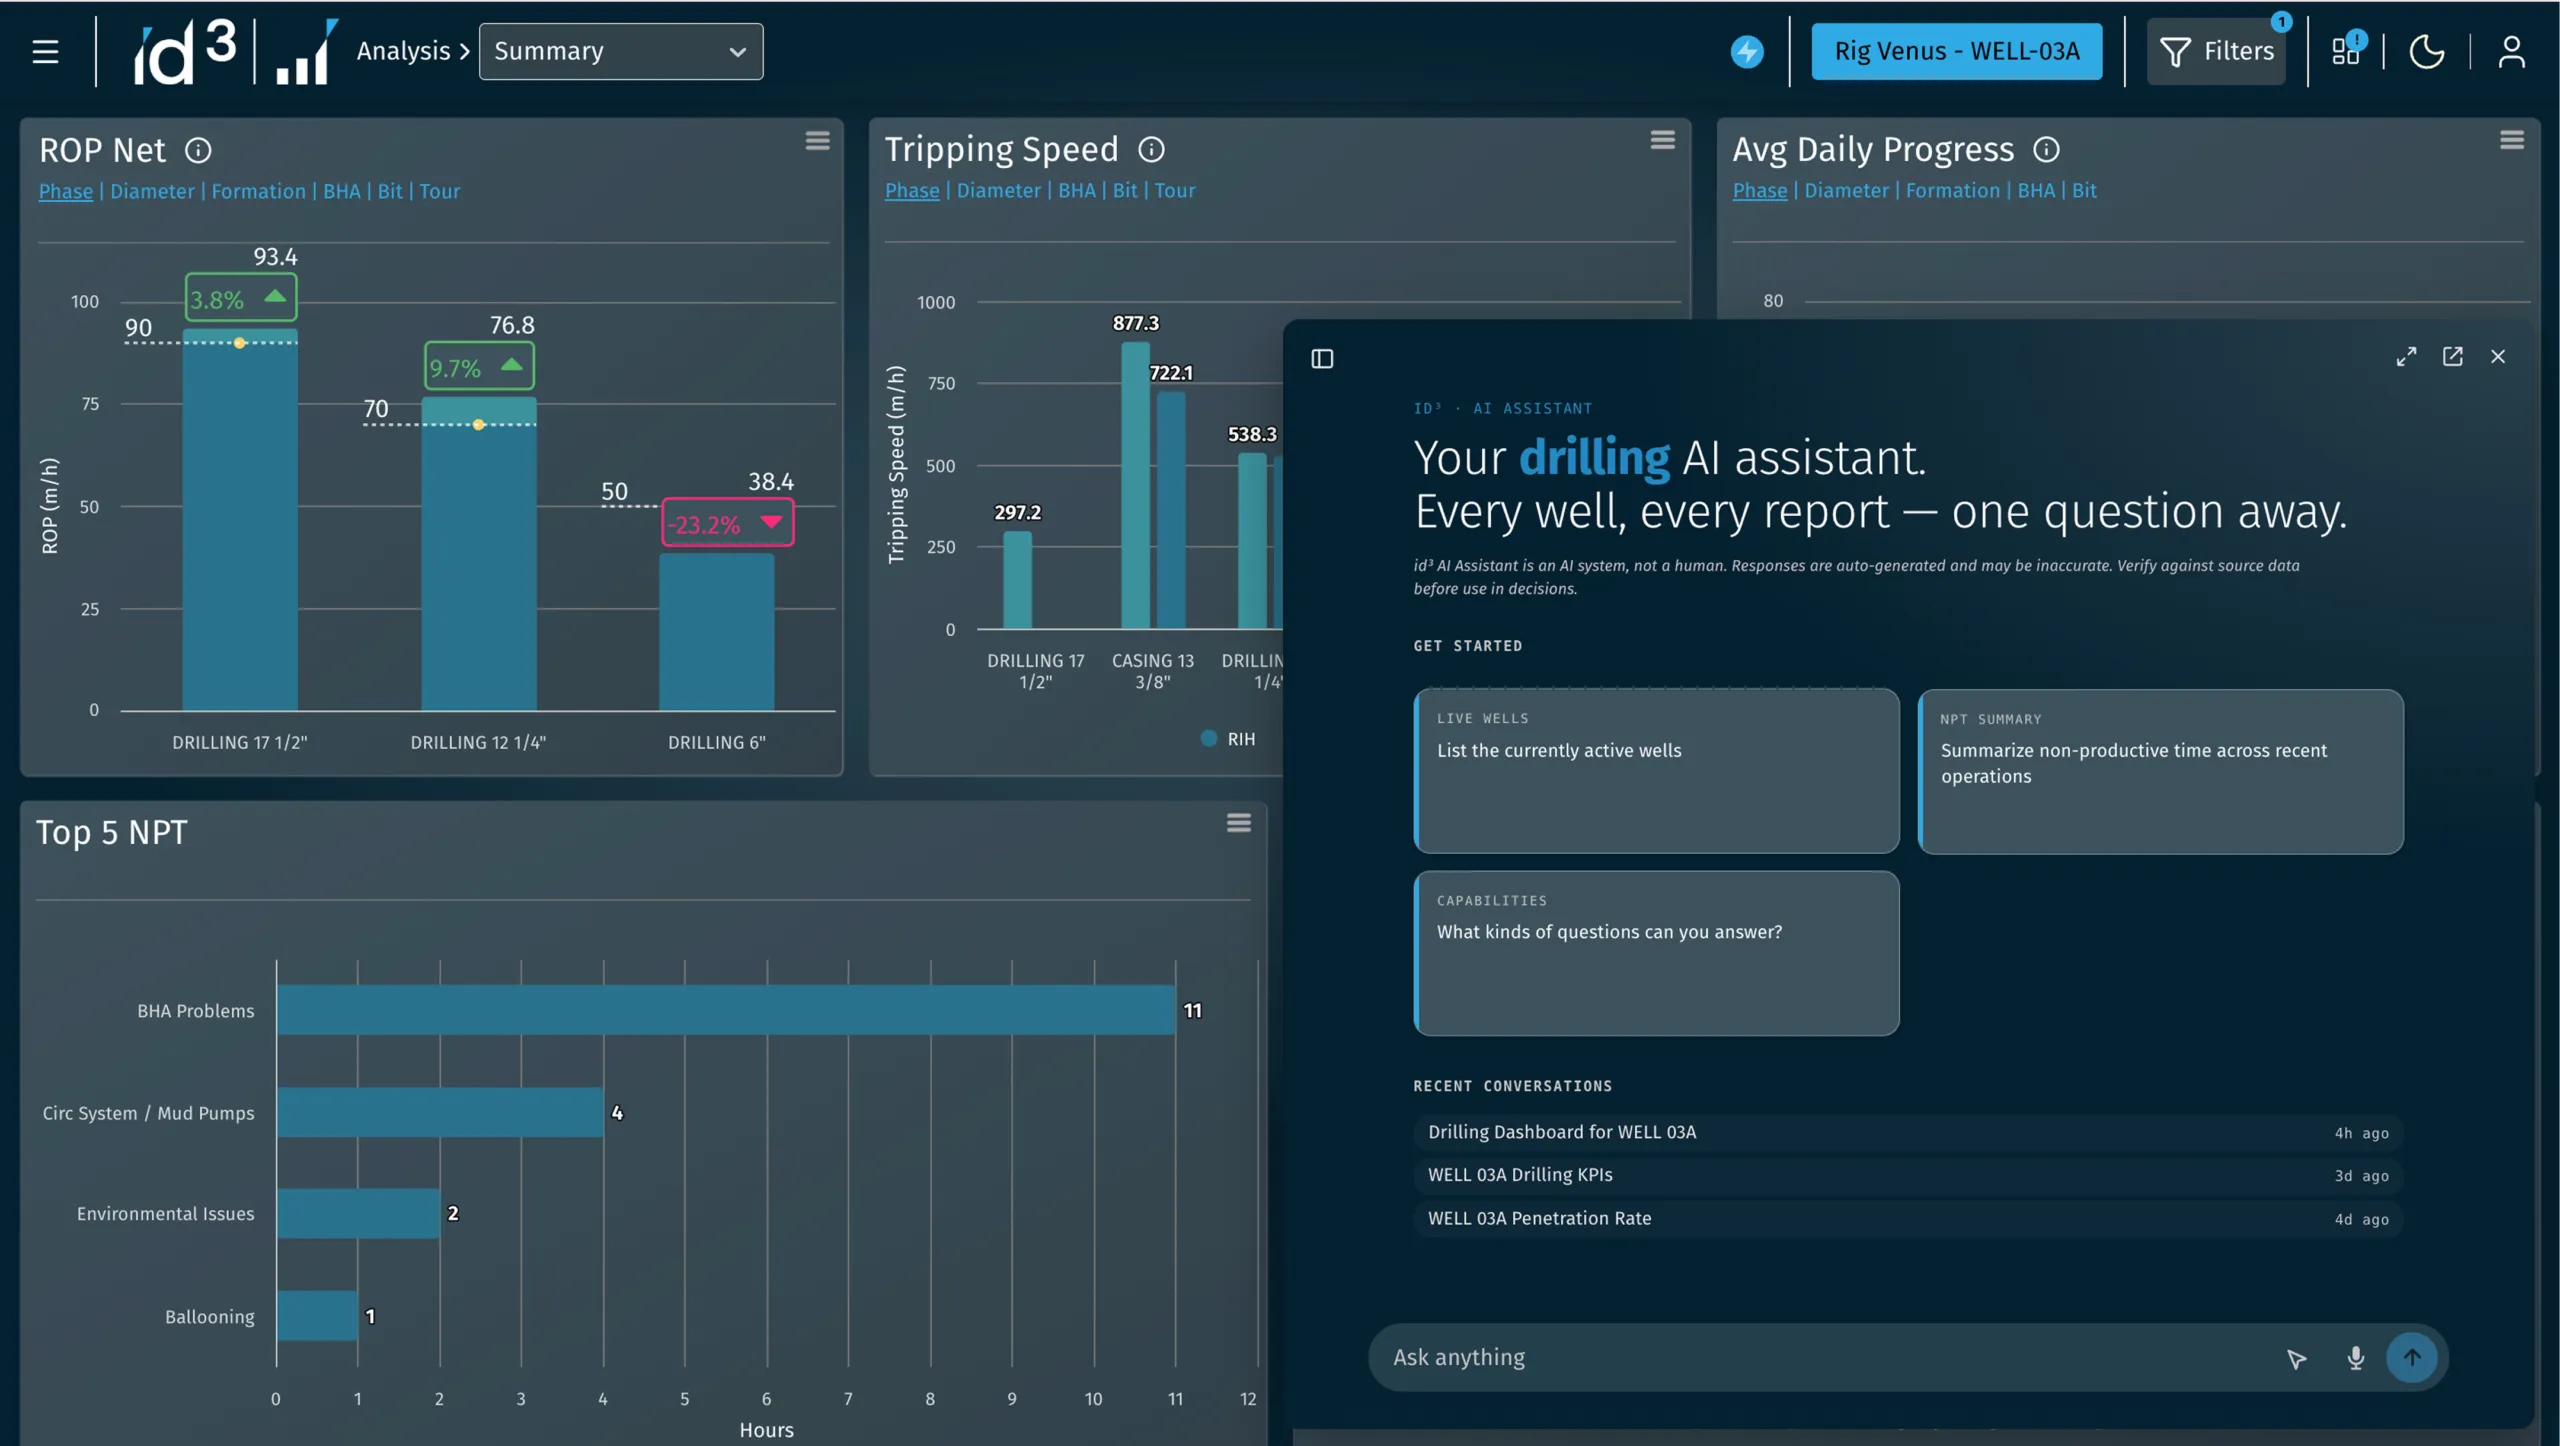
ID3 measures operations performance by interpreting mud logging data. This avoids bias and makes the analysis more granular. It focuses on a set of operations that can be detected automatically (tripping, drilling, circulating, reaming, on slip and others), which already cover around 60-70% of overall drilling time.
With activities detected at this level of detail, ID3 supports an in-depth analysis to boost performance. Rig performance is one example. Some KPIs depend only on crew performance, not on well design or geological conditions:
- Cased hole tripping speed
- Connection time
These KPIs can be measured during both tripping and casing operations. In the Tripping tab of ID3, shown in the figure, simple selections let users analyse overall tripping performance and focus on RIH (run in hole) or POOH (pull out of hole) operations, in cased hole or open hole.
The outcome
The graphs summarize the main results of the analysis of a drillship’s performance, compared with three similar campaigns in Asia, Africa and the USA:
- In the campaign under evaluation, the percentage of rig-dependent NPT increased compared with the previous campaign, except for the rig NPT of the USA campaign.
- Tripping performance, considering both cased hole tripping and connection time, is improving.
- Time spent on connections is decreasing, which shows a learning effect in crew performance.